Binance Coin Price Prediction – May 20
Presently, it is that the BNB market musters a momentum at a lower-trading spot to swing against the US Dollar’s purchasing power rate. The crypto-economic price is between $311 and $304 at a minimal positive percentage rate of 0.46.
Binance Coin Price Statistics:
BNB price now – $307.58
BNB market cap – $50.2billion
BNB circulating supply – 163.3 million
BNB total supply – 163.3 million
Coinmarketcap ranking – #5
Binance Coin Market
Key Levels:
Resistance levels: $320, $340, $360
Support levels: $260, $240, $220
BNB /USD – Daily Chart
The daily chart exhibits that the BNB market operation musters a momentum to spring upward back on the track to the upside below the trend lines of the SMAs. The bearish channels are below the trend line of the bigger SMA. The 14-day SMA indicator is underneath the 50-day SMA indicator. The Stochastic Oscillators have somewhat slantingly traveled northbound across variant range lines. And they are yet attempting to penetrate the overbought region.
Will the BNB/USD market bulls leverage the current bullish momentum gathering outlook?
On May 12th trading session, the BNB/USD market dropped significantly to touch a lowly support line at $200. But, shortly, it gained an upward reversal to set up a bullish momentum mustering pace. Long-position takers may now have to look for a decent buying moment. It may not be a good time for short-term buyers to come in now that it might have late.
On the downside of the technical analysis, the trading situation currently seems to head to another critical trading spot of variant resistances around the SMAs. The higher-rated resistance trading level is at $240 around the 14-day SMA trading indicator. The moment a correction tends to re-occur around the value line, the better chance for the BNB/USD market short-position takers to join the market, back in its downward trend returning operations.
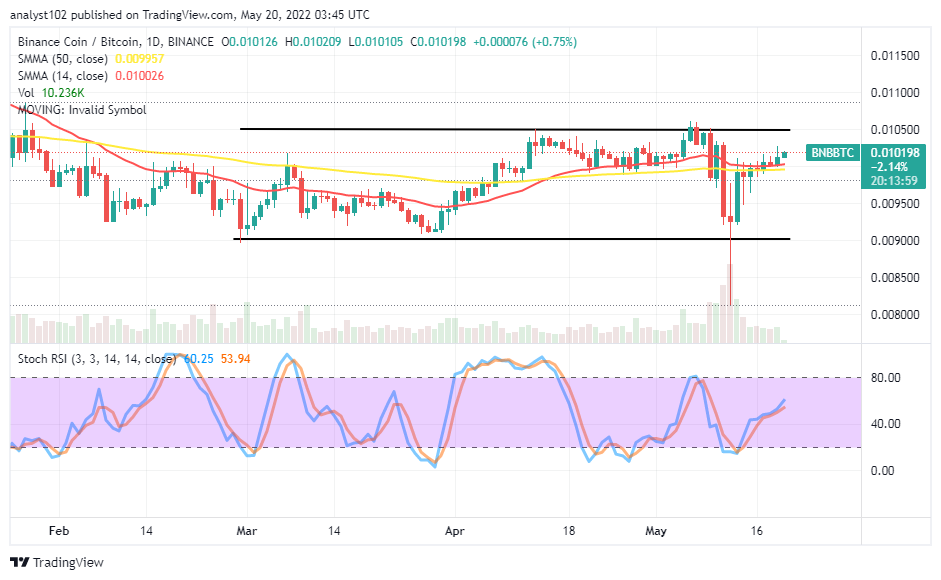
BNB/BTC Price Analysis
In comparison, Binance Coin has been pushing against the trending worth of Bitcoin in wider range-bound zones. Presently, the cryptocurrency pair price musters a momentum toward the north side within the specified range-bound zones. The 14-day SMA indicator has almost conjoined with the 50-day SMA indicator in the range-bound trading spots. The Stochastic Oscillators have managed to move northbound to the range of 60. The base crypto is leading in the range-bound areas against the counter crypto. But, it still needs to push further against the upper range line sustainably to signify BNB is out for a bullish trending outlook against BTC.
Looking to buy or trade Binance Coin (BNB) now? Invest at eToro!

68% of retail investor accounts lose money when trading CFDs with this provider.
Read more:
Credit: Source link


