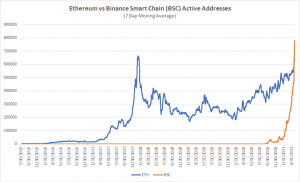
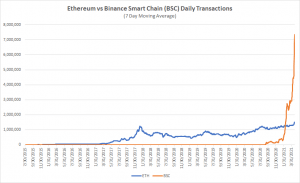
Centralized Binance Smart Chain (BSC) has been outperforming decentralized Ethereum (ETH) lately in several network metrics, including daily active addresses, daily transactions, daily tokens transfers, and average gas price – but not in the number of unique addresses.
Since its launch in September 2020, Binance Smart Chain has been much discussed as a potential competitor to Ethereum, particularly given the latter’s well-known high fee issue. What’s more, different projects – including decentralized finance (DeFi) ones – have been recently expanding to BSC or migrating to it from Ethereum, citing high fees as a cause.
And now it seems that BSC has been swiftly overtaking Ethereum in a number of network metrics.
Per Ethercan.io data, daily active Ethereum addresses reached 648,188 on Sunday, April 25. In comparison, the highest recorded number was 719,094 in January 2018.
While relatively stagnating between September and late December 2020, the daily number of unique addresses that were active on the BSC started rising, shooting up since February 2021, per BscScan.com. Its peak was 1.08m just five days ago, standing at 729,221 on April 25 – over 81,000 more than Ethereum.

@zero_sensor @Rewkang The projects that bridge over to bsc will profit from this trend. Don’t be a hater lol. I thi… https://t.co/Kdfw3bUQHc
Meanwhile, Ethereum unique addresses have seen a constant and significant rise since mid-2017. Between April 25 that year and the same date this year, the unique addresses increased 9,813% to 149.32m.
BSC unique addresses jumped 4,735.3% between mid-February and yesterday, going from 1.38m to 67.08m. Despite the smaller number, the percentage is nearly half of the increase seen by Ethereum, but gained in much shorter time.
The Ethereum daily transactions chart shows 1.39m total transaction on Sunday. Three days prior, it reached a high of 1.57m.
BSC has seen a significantly higher number here on the same day. Daily transactions were 7.2m, down from its all-time high of 9.1m, reached four days earlier.

The number of ERC-20 tokens transferred daily is currently lower than the previously seen, short-lasting all-time highs, the highest among them being 1.57m in June 2018. On Sunday, this number was 938,826, recording a drop from the days prior.
Meanwhile, 8.1m BEP-20 tokens were transferred on Sunday, down from the April 21 ATH of 10.3m, and up 2,733% since the year started.
The daily average gas price used on Ethereum on Sunday was 55.4 gwei – the lowest it’s been since the year began. The highest recorded in 2021 was February’s 373.8 Gwei, while its short-lived all-time high is 939.59 gwei from 2016.
This picture is quite different over on BSC. While peaking for one day to 305 Gwei in late August, the daily average gas price has been relatively stable since, then gradually dropping since February. On April 25, it was 6.7 gwei.
“BSC activity is on a monster parabola with no signs of stopping,” wrote Andrew Køng of Mechanism Capital. “It is apparent that while the pie is growing, BSC is capturing the [lion’s] share of the new retail entrants.”
As for Ethereum network activity metrics, Køng argued that the growth doesn’t yet seem parabolic, that the metrics are only just starting to surpass the last cycle peak, and “that there may still be a lot of room to grow.”
He also likened the arguments of BSC being only for scams and Ponzi tokens to claims that Bitcoin (BTC) is only good for drugs and criminal activity.
Others noted BSC’s “exponential” growth as well. ‘K’ argued that “the argument of “see how much demand this copy of [ETH] has, this is bullish for [ETH]” is just plain wrong.” Users who care about decentralization and are fine with paying USD 100 per transaction are already deep in DeFi, they said, but those who don’t care and are currently priced out of Ethereum “are 99% of all future DeFi users.”
Meanwhile, Three Arrows Capital CEO Zhu Su said that he thinks that “BSC has been one of the most bullish catalysts ever for ETH”: “Metaverse is not zero sum. Going to Mars is not bearish for Earth.”
At 16:22 UTC, ETH is trading at USD 2,484, having appreciated 6% in a day and 11% in a week. Binance coin (BNB) also turned green in both time frames, going up 5% in a day and 11% in a week, and changing hands at USD 534. BNB also rallied by 110% in a month and 3,190% in a year, compared with ETH’s 46% monthly gain and a 1,180% jump in a year.
____
Learn more:
– Ethereum Developers On Why They Don’t See Cardano & Binance Chain As Rivals
– How Bitcoin and DeFi are Completely Different Phenomena
– Ethereum Won’t Hide From Quantum Computers Behind PoS Shield
– New Generation of ‘Bitconnectors’ Flock into SafeMoon Despite Warnings
– Too Costly Ethereum is Pushing DeFi Users Away, Fuelling BNB Rally
– Binance Smart Chain Put to Political Test, as More ETH-Based Projects Use It
Credit: Source link


