BCH Market Strives to Move – August 11
The BCH/USD market strives to move northward after long sideways trading formation in the ranges of $400 and $600 recently. Even the crypto market has not moved convincingly far away from the range zones as it trades around the value at $608 to record a rate of 2.70% increases.
Market Strives to Move: BCH Market
Key Levels:
Resistance levels: $700, $900, $1,100
Support levels: $500, $400, $300
The BCH/USD daily chart shows that the crypto market strives to move northward with weak catalysts. That is the reason why bulls have not been able to drive past above the $600 line. The 14-day SMA indicator slightly curves northward, close beneath the 50-day SMA indicator. The bearish trend-line drew downward to markdown line $600 as an area that traders should be wary of. The Stochastic Oscillators are seemingly moving in a consolidation manner around range 80. They appear like the lines are somewhat pointing towards the north to indicate that the crypto’s valuation is on a promissory increase note.
As the market strives northward, will there be the energy to sustain it at a higher zone?
The degree of energy that the BCH/USD price possesses now appears not strong enough to sustain at a higher zone as the market strives to move northward further. However, there have been signs that the crypto may continue to push on a serial pattern to the upside. An aggressive price reversion against the line at $600 may put an end to seeing more ups for a while above the point.
Regarding the downside of the crypto economy, bears needed to watch out for convergence of candlesticks around the line of $600 with an eventual breakdown of the formation to get a decent sell signal of the market. That said, a pause of price action may feature at higher trading of $700. If the bigger SMA trend-line crossed northward by the smaller SMA trend-line, it would potentially be that more movements to the north confirmed. Therefore, the BCH/USD market bears would have to suspend the launching of sell orders.
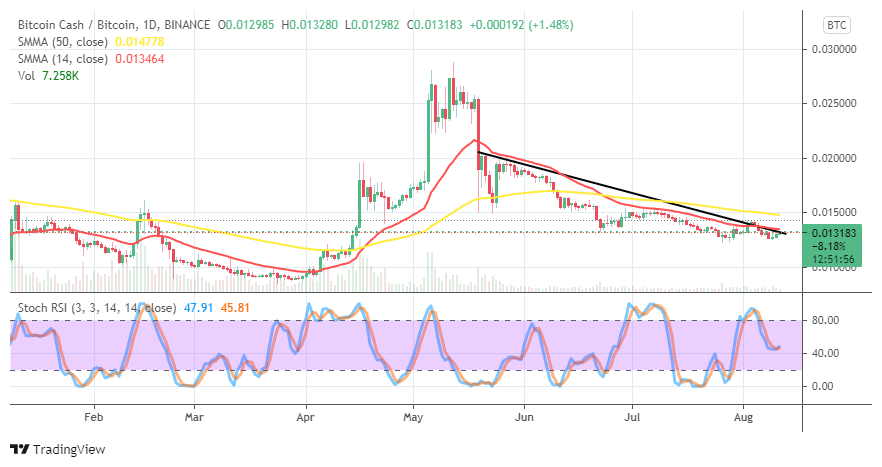
BCH/BTC Price Analysis
The BCH/BTC price analysis chart shows that the base instrument relatively holds under a falling pressure inflicted on it by the counter-trading tool. In other words, Bitcoin Cash cannot move northward as compared with Bitcoin. The 50-day SMA indicator is above the 14-day SMA indicator. The Stochastic Oscillators are seemingly attempting to cross the lines northbound. That implies that the base instrument may soon tend to trend against the most expensive counter crypto.
Looking to buy or trade Bitcoin Cash (BCH) now? Invest at eToro!
75% of retail investor accounts lose money when trading CFDs with this provider.
Credit: Source link


