BCH May go Down Soon – April 20
Bitcoin Cash may go down soon, as it trades against the valuation of the US Dollar. There have been less-active motions as price features between the high and the low points of $340 and $334. And the percentage rate of trading is at 1.17 negative.
BCH May go Down Soon: BCH Market
Key Levels:
Resistance levels: $400, $450, $500
Support levels: $300, $250, $200
BCH/USD – Daily Chart
The daily chart reveals BCH may go down soon as it trades against the market worth of the US Dollar. Over a couple of sessions, the market faces a line of rejections tightly underneath the trading-resistant line at $350. The 50-day SMA indicator is at the value-line, indicating the spot important in determining the market’s following trading action, and the 14-day SMA indicator is below it. The Stochastic Oscillators have moved northbound, briefly swerving the line into the overbought region.
Is there any indication that BCH will surge more past $350 against the USD as it faces a rejection around the value line?
A sudden surging past the $350 may not sustain a long-term running session afterward. The current pace of forces put up by the BCH economy doesn’t possess an ideal energy stature to nudge the situation through some resistances beyond the 50-day SMA trend. Based on that, it would be ideally technical that long-position takers allow price to make a pull-down form around its present trading spot to get a re-launch of decent entry.
On the downside of the technical analysis, the BCH/USD market-position placers may have to be on the lookout for a reversal of price actions around the $350 trading line before taking a sell order. Fee fall-offs are not to occur. But, a breakdown at the $300 support level will potentially set the crypto’s price into a lower-trading spot, closely averaging lower line around the $250 support level.
BCH/BTC Price Analysis
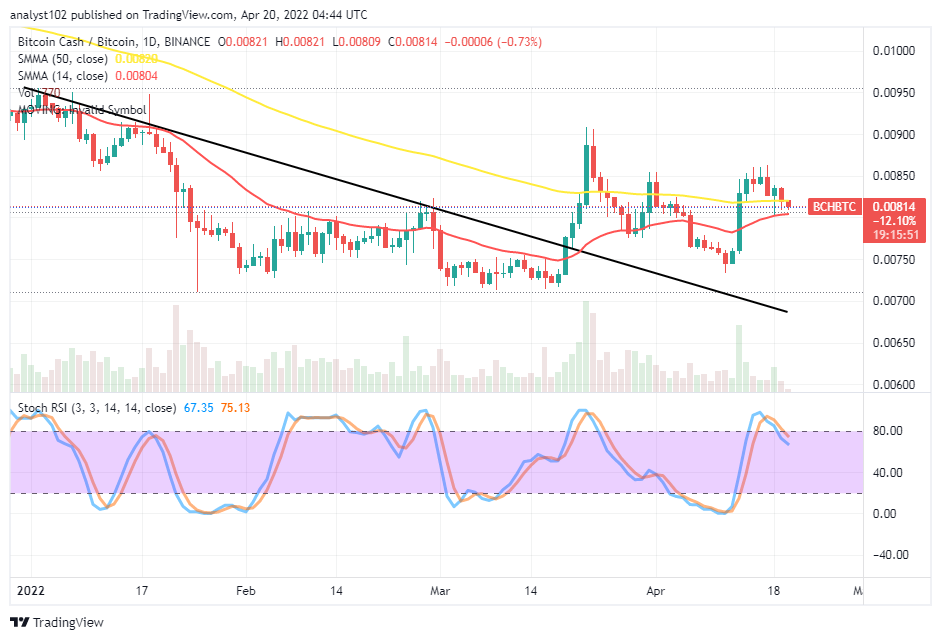
In comparison, Bitcoin Cash appears, settling for a correction in its valuation pairing with Bitcoin. In other words, BCH as the base crypto may go down soon against its counter-trading crypto in the subsequent business operations. The 14-day SMA indicator is closer to the 50-day SMA indicator from beneath. The Stochastic Oscillators have crossed their lines southbound, slightly against the range line at 80. With the formation of variant candlesticks, the situation suggests BCH will still go down against BTC.
Looking to buy or trade Bitcoin (BTC) now? Invest at eToro!

68% of retail investor accounts lose money when trading CFDs with this provider.
Read more:
Credit: Source link


