Basic Attention Token (BAT) Price Prediction – June 15
The BAT/USD market seems to have reached a deep-shallow trading zone as the crypto prepares for an upswing. The return on investment percentage stands at 88.26 positives. Price has reached an all-time high of 1.92 from an all-time low value of $0.06621.
Basic Attention Token (BAT) Price Statistics:
BAT price now – $0.3177
BAT market cap – $474 million
BAT circulating supply – 1.5 billion
BAT total supply – 1.5 billion
Coinmarketcap ranking – #69
Basic Attention Token (BAT) Market
Key Levels:
Resistance levels: $0.40, $0.50, $0.60
Support levels: $0.20, $0.15, $0.10
BAT/USD – Daily Chart
The daily chart reveals Basic Attention Token (BAT) is getting ready for an upswing. The 50-day SMA indicator is around $0.56 above the 14-day SMA indicator, which is around the $0.38 value line. The bigger trading SMA drew alongside the upper bearish trend line. The Stochastic Oscillators are in the oversold region. And they have briefly crossed the lines northbound against the range at 20.
Will the BAT/USD market lose momentum to the area of a lower bearish trend line?
The lower bearish trend line drew to touch a point around the $0.10 support level to keep an in-depth lower-trading spot that can occur if the BAT/USD trade fails to push more high as it prepares for an upswing motion. A smaller bullish candlestick occurred during yesterday’s session. And that has given today’s session a hedge to push northward a bit more.
On the downside of the technical analysis, for selling forces to continue to dominate the BAT/USD market operations, the $0.40 needed to serve as the markdown area to obtain a selling order. It still appears bears will have the upper hand in the trade for some time, especially if the price remains inactive to get pushed above the resistant-trading point mentioned earlier. Investors may consider introducing their capital bit by bit to leave to run on a long-term basis as price tends to fall.
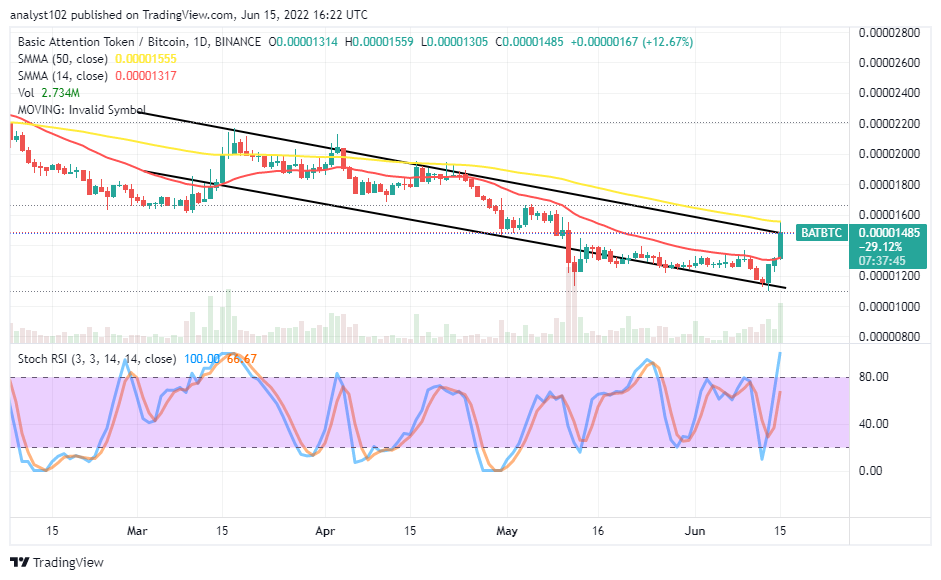
BAT/BTC Price Analysis
Basic Attention Token has been over several hours running into about three days been striving to push against Bitcoin’s trending capacity in the comparison. The currency pair price prepares for an upswing motion as some bullish candlesticks have emerged to break northward past the smaller SMA to touch the bigger SMA. The 50-day SMA indicator is above the 14-day SMA indicator. And they still positioned southward. The Stochastic Oscillators are northbound swerved through variant range lines to indicate a bullish force is ongoing. If the present candlestick tends up featuring a top shadow, which can mean the base crypto may soon be losing the momentum to the counter crypto.

Our Recommended Crypto Exchange for U.S. customers
- 120+ Cryptos Wallet Available
- Paypal available
- Licensed and regulated in the U.S.
- Social trading Platform & copy trading
- Low trading fees
68% of retail investor accounts lose money when trading CFDs with this provider.
Read more:
Credit: Source link


