The API3 price prediction sets a bullish run as the market attempts to climb above the resistance level of $2.6.
API3 Prediction Statistics Data:
- API3 price now – $2.47
- API3 market cap – $140 million
- API3 circulating supply – 56.5 million
- API3 total supply – 113.9 million
- API3 Coinmarketcap ranking – #171
API3/USD Market
Key Levels:
Resistance levels: $3.2, $3.4, $3.6
Support levels: $2.0, $1.8, $1.6
Buy API3 Now
Your capital is at risk.
API3/USD is running a little retracement move toward the upper boundary of the channel with price growth of 3.81%. For the fact that the coin is recording some gain, the API3 price may cross above the channel if the coin stays above the 9-day and 21-day moving averages. Therefore, traders can expect the price to continue to rise as soon as the bulls put more pressure on the market.

API3 May Demonstrate Bullish Movement, Tamadoge (TAMA) Exhibits Fresh Growth
The API3 price is hovering above the 9-day and 21-day moving averages at around $2.47, but if the coin slides below the support level of $2.30, the market price may slide back towards the lower boundary of the channel. But if the price continues to follow the upward movement, traders can then expect a bullish continuation as the technical indicator Relative Strength Index (14) moves to cross into the overbought region, the possible resistance levels could be found at $3.2, $3.4, and $3.6 in the long term.
Moreover, if the coin keeps the bullish movement for the next couple of days, traders may witness more positive moves to reach higher levels. Meanwhile, the API3 price is currently moving towards the upside. Inversely, any bearish movement towards the south could roll the coin back to the long-term support levels at $2.0, $1.8, and $1.6.
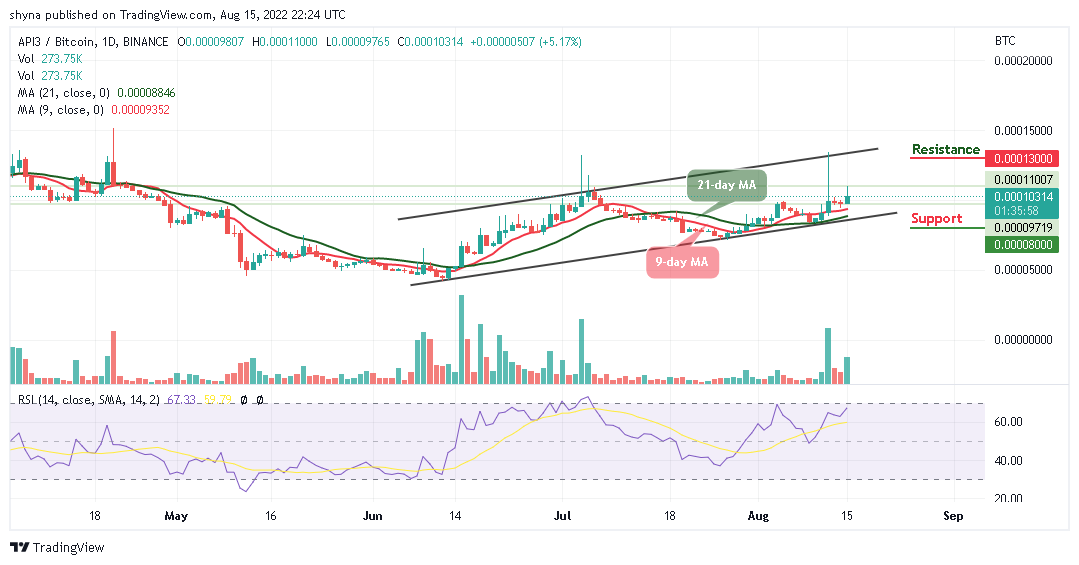
When compared with Bitcoin, API3 is facing upward movement, trading above the 9-day and 21-day moving averages. In case of a trend reversal, there is a need for an increasing volume and resistance to cause an upsurge in the market. At the moment, the API3 price is hovering around 103 SAT. Any bearish movement below the current market value may locate the close support at 800 SAT and below.

However, if a bullish move continues to push the price above the moving averages to hit the nearest resistance at 1100 SAT; traders can confirm a bull run for the coin and the closest resistance could be located at 1300 SAT and above as the technical indicator Relative Strength Index (14) moves to cross into the overbought region, suggesting bullish movement.
Tamadoge – Play to Earn Meme Coin
- Earn TAMA in Battles With Doge Pets
- Capped Supply of 2 Bn, Token Burn
- NFT-Based Metaverse Game
- Presale Live Now – tamadoge.io
Related
Credit: Source link


