XRP Fails Surging Northbound– June 2
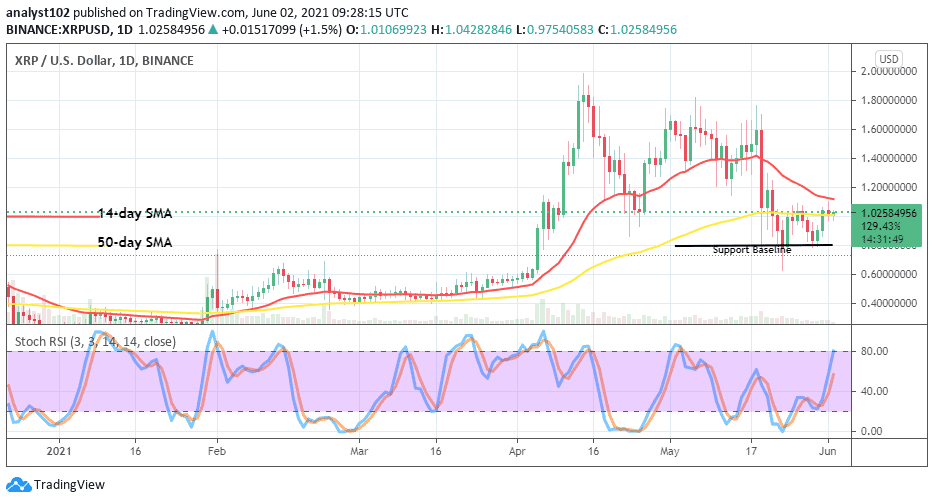
The market valuation of XRP/USD has been struggling to swing upward from an in-depth of the lower trading zone. But, the crypto market fails surging northbound while initially striving toward the resistance of $1.15 to now trade around the level of $1.02 at a 1.15% increase.
Fails Surging Northbound: XRP Market
Key Levels:
Resistance levels: $1.15, $1.35, $1.55
Support levels: $0.80, $0.70, $0.60
XRP/USD – Daily Chart
The XRP/USD daily chart shows that the crypto’s market valuation has been an attempt to strengthen the capacity. But, it fails to surge northbound while it touched the smaller SMA trend-line from below during yesterday’s session. The 50-day SMA indicator is situated at the level of $1 below the 14-day SMA trend-line. The critical support baseline drew at a lower line of $0.80. The Stochastic Oscillators are swerving toward the north to suggest an ongoing upward movement. Despite that, the base cryptocurrency lacks the active northward move needed to sustainably stay afloat in the market.
The Ripple XRP/USD market fails surging northbound will be on for how long?
There are variant stages of market trading situations at a particular cycle in time. The Ripple XRP/USD market fails surging northbound past the resistance of $1.15 is one of the usual situations that’s bound to happen in any risky financial operation. Currently, the market point of $1 appears to be the main zone that further trade decisions will be made. And, it is most likely that bulls may find support around it to push to the upside in no time.
Consolidation of the XRP/USD price around the values of $1 and $1.20 may either lead to a full-fledged range-bound trading situation or a strong downward reversal against the former line in the long run. A touch of the bigger SMA by the 14-day SMA seems not releasable most importantly that the market still experiences low-active price action. A breakdown of the first value earlier mentioned could mean to purposely revisit the baseline support
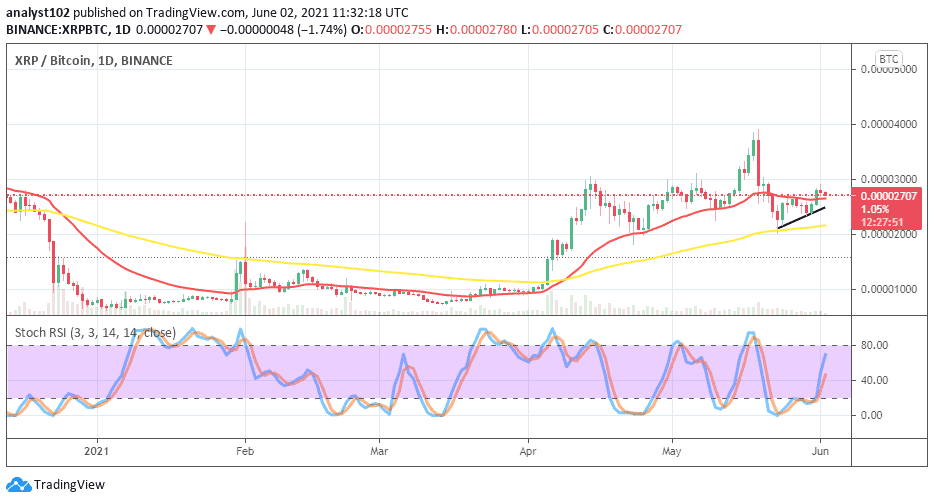
In comparison, there has been a relative trending weight in the valuation of Ripple XRP as paired with Bitcoin on the daily price analysis chart. The base crypto now very weakly pushes on the buy signal side close above the smaller SMA. The 50-day SMA indicator is located underneath the 14-day SMA trend-line. The short bullish trend-line drew in between the SMAs to show the path of that the attempted short upswings are being made. The Stochastic Oscillators have swerved northward from around range 20 to briefly point toward the north close below range 80. That suggests that some degree of slight buying pressures are going on to indicate that Ripple XRP is to an extent having an upper hand to move its stance against Bitcoin as they’re paired in no time. Therefore, the ripple XRP market currently fails to surge northbound forcefully could be that the crypto is undergoing some level that has to do with experiencing a pit stop for a while.
Remember, all trading carries risk. Past performance is no guarantee of future results.
Credit: Source link


