Join Our Telegram channel to stay up to date on breaking news coverage
The Aave price prediction reveals that AAVE records a gain of 6.21% as the bulls increase the buying pressure for the coin to approach higher levels.
Aave Prediction Statistic Data:
- Aave price now: $59.37
- Aave market cap: $864.3 million
- Aave circulating supply:$14.6 million
- Aave total supply: $16 million
- Aave Coinmarketcap ranking: #43
AAVE/USD Market
Key Levels:
Resistance levels: $70.0, $75.0, $80.0
Support levels: $45.0, $40.0, $35.0
AAVE/USD is seen trading in the green at the time of writing as the coin spikes above the upper boundary of the channel with a gain of 6.21%. According to the daily chart, the candle formations may continue to follow the upward movement if the bulls increase the pressure.
Aave Price Prediction: AAVE/USD Could Gain More Uptrends
According to the daily chart, the Aave price turned the corner with the stock markets earlier this week. After convincingly breaching the $62.9 level a few hours ago, there has been no return for the cryptocurrency. It has since gone up among all other coins in the market. Meanwhile, an increase above the upper boundary of the channel could trigger intense buying to the resistance levels of $70.0, $75.0, and $80.0.
Furthermore, the technical indicator Relative Strength Index (14) moves to cross above the 60-level, pointing to the north. On the contrary, the Aave price may hold a support level at $55.8, and if it drops below this support level, it could hit another support at $50.0. Meanwhile, the next support after this is located below the lower boundary of the channel where it may dip to the supports at $45.0, $40.0, and $35.0 if the selling volume returns to the market.
AAVE/BTC Could Spike to the North
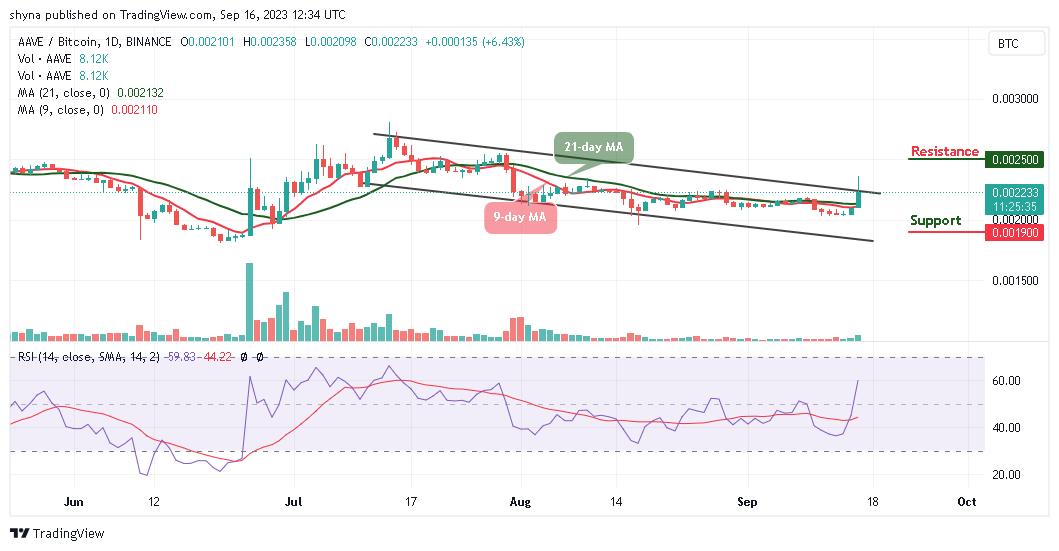
Against Bitcoin, AAVE buyers are dominating the market as the coin remains above the 9-day and 21-day moving averages. Meanwhile, from the upside, the nearest level of resistance lies at 2500 SAT and above as the technical indicator Relative Strength Index (14) moves to cross above the 60-level.

Therefore, looking at the downside; the nearest support level is located at 2000 SAT if the price drops further to create a new low, lower support could be found at 1900 SAT and below. Meanwhile, the 9-day MA is below the 21-day MA, but if the coin spikes to the upside, it could hit the resistance level of 2400 SAT.
Alternatives to Aave
Looking at the daily chart, the Aave price is likely to increase the bullish movement if the price reclaims the resistance level of $62.90 above the upper boundary of the channel. At the moment, the technical indicator Relative Strength Index (14) is moving to cross above the 60-level and this could send bullish signals to encourage more buyers to enter the market.
While this is happening, the Wall Street Memes token has progressed to its final stage, offering you the opportunity to purchase it at the current presale rate before it gets listed on exchanges. Thus far, it has raised over $25 million in funding in preparation for its official launch in the forthcoming days.
Wall Street Memes Presale SEVERAL DAYS TO GO – This is the next 100X meme coin crypto!
Ends Soon – Wall Street Memes
- Early Access Presale Live Now
- Established Community of Stocks & Crypto Traders
- Featured on Cointelegraph, CoinMarketCap, Yahoo Finance
- Rated Best Crypto to Buy Now In Meme Coin Sector
- Team Behind OpenSea NFT Collection – Wall St Bulls
- Tier One Exchange Listings September 27
- Tweets Replied to by Elon Musk
Join Our Telegram channel to stay up to date on breaking news coverage
Credit: Source link


