Two leading exchange-traded fund (ETF) providers have set their sights on launching the first spot Ethereum ETF in the U.S. after continued delays from regulators on approving a spot Bitcoin ETF.
ARK Invest and asset manager VanEck filed proposals with the Securities and Exchange Commission (SEC) for Ethereum ETFs that would trade on CBOE Global Markets’ BZX Exchange.
Considering the current developments in crypto ETFs, what are the best cryptos to buy now?
The move comes just days after the SEC pushed back its deadline to approve or deny several spot Bitcoin ETF applications from asset managers like Valkyrie, Invesco, and WisdomTree.
“This kicks off the official race to launch the first U.S. spot Ether ETF,” said Bloomberg Intelligence ETF analyst James Seyffart, who predicts a decision on the newly filed Ethereum ETF applications by May 2024.
The SEC has repeatedly delayed approving any spot crypto ETFs over concerns around price volatility, valuation, liquidity, and potential manipulation in the underlying assets. The regulator has only allowed ETFs based on bitcoin futures to come to market so far.
However, proponents argue that the market has matured significantly, pointing to growing adoption, regulated crypto exchanges, and a market cap of over $1 trillion.
The SEC’s continued resistance recently led Grayscale, the world’s largest digital asset manager, to sue the regulator for denying its Bitcoin ETF application.
Earlier this month, a federal appeals court ruled that the SEC must reexamine Grayscale’s proposed Bitcoin ETF after incorrectly applying standards on manipulation risk and investor protection.
While the decision marked a small victory for the industry, the outcome of the SEC’s review remains uncertain.
With regulators still hesitant on spot Bitcoin ETFs, providers seem ready to shift focus to Ethereum as the next best alternative.
Though less established than Bitcoin, Ethereum is the second largest cryptocurrency with a market cap of approximately $200 billion.
ProShares, the company behind the first U.S. Bitcoin futures ETF, said it may also pivot to an Ethereum futures ETF if spot bitcoin continues to face regulatory pushback.
With major players like BlackRock and Fidelity expressing interest in crypto offerings, asset managers appear determined to bring investment exposure to U.S. investors one way or another.
The SEC has until mid-October to approve or deny pending spot Bitcoin ETF applications. But based on its history of pushing back decisions and rejecting most filings thus far, there is skepticism that spot Bitcoin ETFs will get approved anytime soon.
This latest pivot to Ethereum by major issuers signals that the industry remains resilient and will continue seeking regulated investment products for investors to gain cryptocurrency exposure.
Based on the current state of the cryptocurrency market, THORChain, Wall Street Memes, Toncoin, Bitcoin BSC, and Render stand out as some of the best cryptos to buy now thanks to their robust fundamentals and/or favorable technical analysis.
Traders Anticipate THORChain’s (RUNE) Next Move: Breakout or Breakdown?

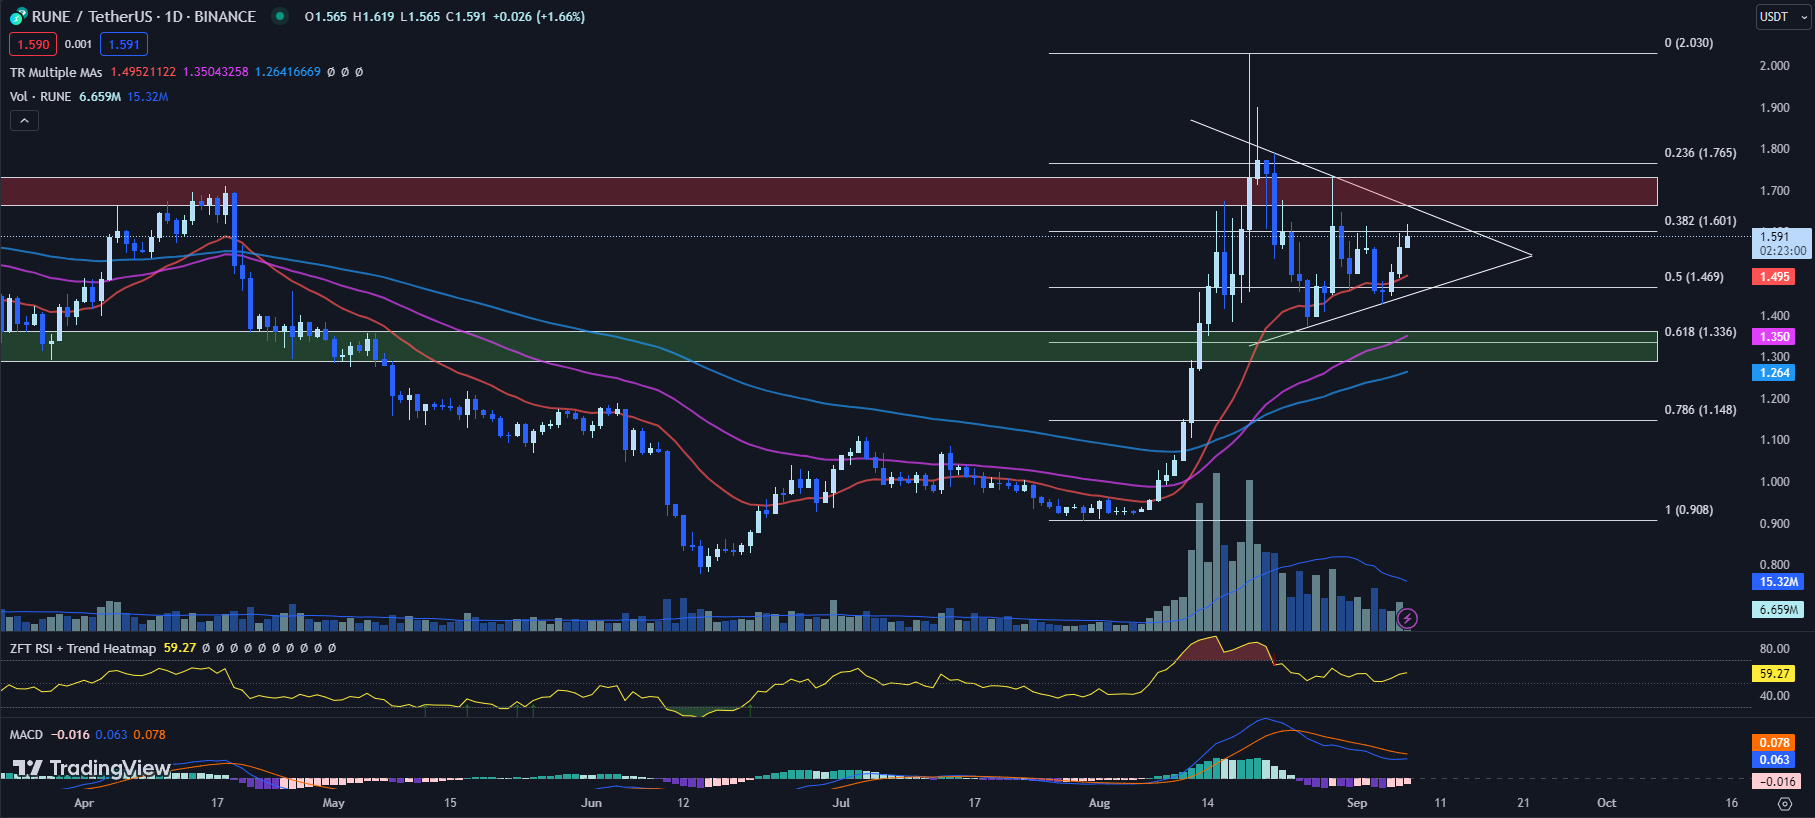
The recent price action of THORChain (RUNE) shows that it is on an upward trend for the third day in a row.
After bouncing back from the Fib 0.5 level at $1.469 and finding support at the 20-day EMA ($1.495), it is now seeking to break through the Fib 0.382 level at $1.601.
Alongside this, the coin is showing signs of a symmetrical triangle pattern, often seen during periods of price consolidation. Adding to this, trading volume has been dropping, which is common before a price breakout or breakdown.
Regarding other technical indicators, the 20-day EMA stands at $1.495, while the 50-day and 100-day EMAs are at $1.350 and $1.264, respectively. This suggests a general bullish trend as the shorter-term EMA is above the longer-term ones.
The RSI has increased from 57.85 to 59.27, indicating that the cryptocurrency is neither overbought nor oversold. The MACD histogram also shows a slight positive change, moving from -0.021 to -0.016.
RUNE is currently priced at $1.591, with a 1.66% increase so far today. Looking at resistance levels, $1.601 is the first target, followed by a more formidable resistance zone ranging from $1.666 to $1.731.
A successful breakout from these levels could lead to retests at even higher resistances of $1.765 and potentially $2.029.
On the downside, the 20-day EMA ($1.495) acts as immediate support, followed by the Fib 0.5 level of $1.469 and an ascending trendline support at $1.449.
If RUNE’s price falls below the ascending trendline, it might lead to a symmetrical triangle breakdown, potentially triggering a move toward the next support zone between $1.290 to $1.363.
In the immediate future, traders should closely watch for a breakout or breakdown from the symmetrical triangle formation to determine RUNE’s next directional move.
WSM: The Highly-Anticipated 2023 Meme Coin Launch with a Million-Strong Community
Wall Street Memes has seen significant interest in its presale phase. Over the past few months, the presale has attracted more than $25 million from early supporters.
This popularity sets high expectations for its upcoming launch on a centralized exchange (CEX) in less than 20 days.
WSM has managed to grab attention with its large community, which now boasts more than a million supporters. This strong community base has contributed to the project becoming one of the most anticipated coin launches for the third quarter of 2023.
Interestingly, the project is inspired by the Wall Street Bets community, which has been known for its anti-bank stance. WSM seeks to convert this sentiment into a cryptocurrency.
The coin’s affordable price point of $0.0337 has also attracted a significant number of early backers. This democratic pricing, coupled with the $25 million raised in the presale, has made WSM one of the best cryptos to buy for many investors.
Additionally, early investors stand to gain an extra 30% upon the initial listing, a feature that has sparked further interest.
One notable occurrence was the investment of $1 million by an unidentified crypto whale. The investment, made in August, was broken down into five transactions totaling 460 ETH, valued at $840,000, carried out within a span of six minutes.
A further 93 ETH had been invested by the same wallet two weeks prior. This large investment has been viewed as a show of confidence in the potential return on investment for WSM.
WSM’s tokenomics places a strong emphasis on community rewards, with 30% of the token supply allocated for this purpose. Additionally, 20% is set aside for liquidity, and 50% is available in the presale.
This community-centric approach has also contributed to its rapid growth on social media platforms.
Transitioning from its roots, inspired by the Wall Street Bets community, WSM is looking to make a significant impact on the crypto market.
The project has already shown signs of strong community support and financial backing, making it a contender for one of the best crypto to buy in the coming months.
Visit Wall Street Memes Now
TON: Price Consolidation at Fibonacci Support Signals Potential Rebound

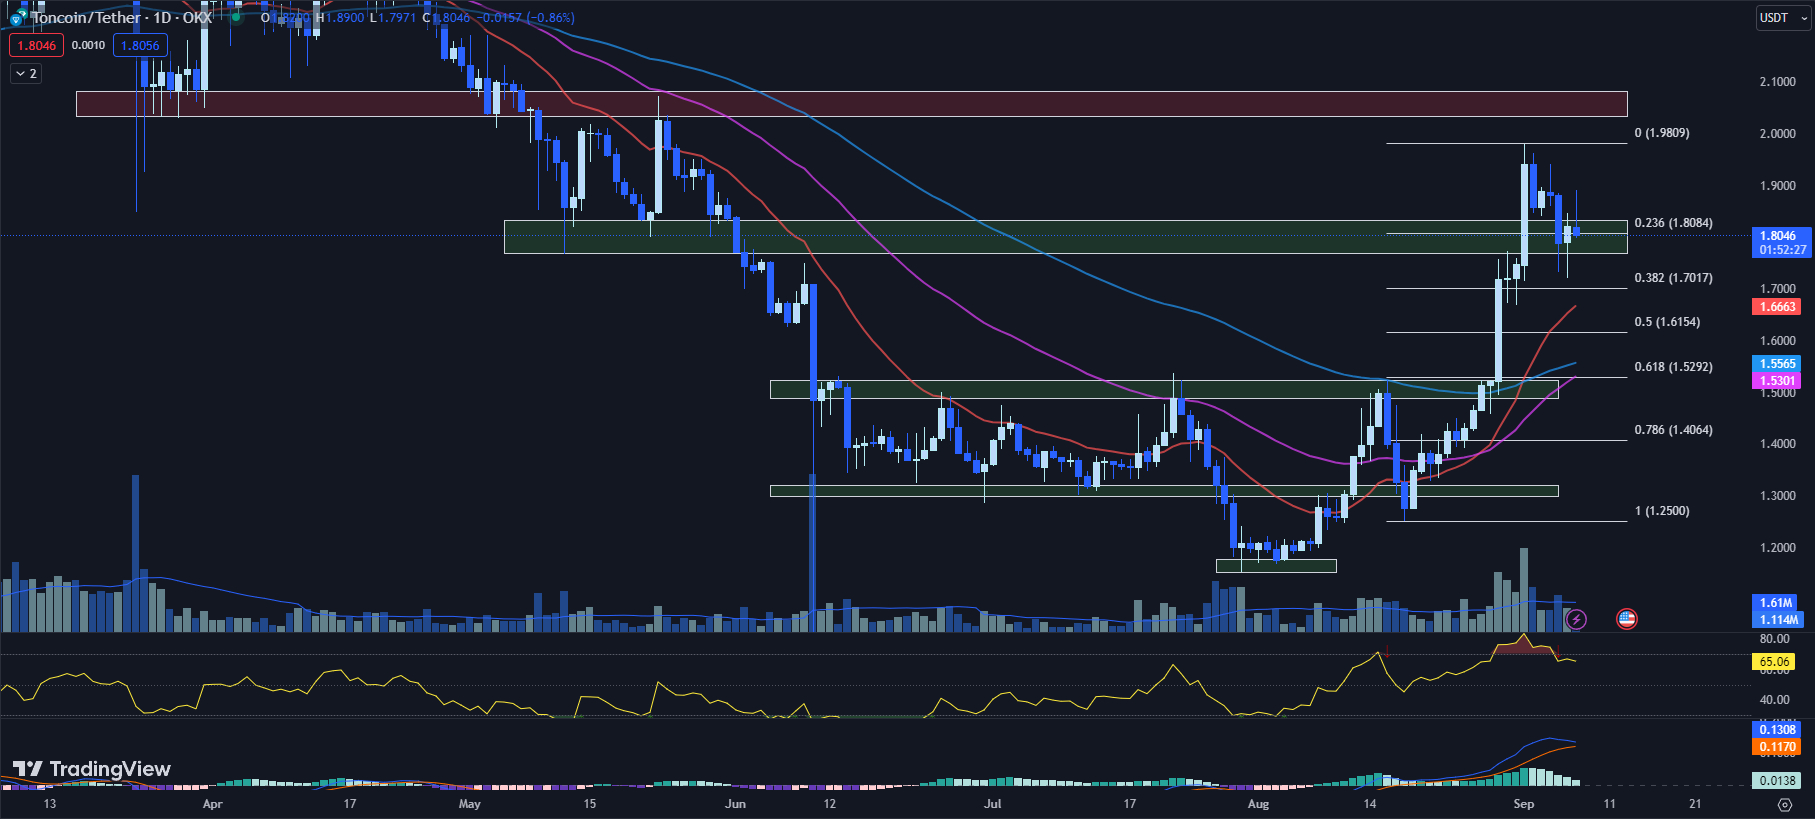
After pulling back from a near two-week upward trend, TON is currently hovering around the Fib 0.236 level at $1.8084. This price level could serve as a potential support, indicating a likely area for price consolidation before TON’s next move.
TON’s 20-day EMA currently stands at $1.6663, which is above the 50-day EMA of $1.53 and the 100-day EMA of $1.5565.
This implies that the immediate trajectory for TON has been predominantly positive. Nonetheless, traders need to watch if the price sustains above these Exponential Moving Averages (EMAs). Any decline beneath them could potentially indicate an impending bearish trend.
TON’s RSI remains virtually the same, standing at 65.06 compared to the previous day’s 65.08. Generally, an RSI surpassing 70 is interpreted as an overbought scenario, while a figure under 30 signifies an oversold situation.
As TON hovers close to the overbought threshold, there’s a potential for further pullback in the near future.
Meanwhile, the MACD histogram has slightly decreased to 0.0138 from yesterday’s 0.0221. While this indicates a decrease in bullish momentum, the MACD line still remains above the signal line, which may indicate that the cryptocurrency remains in a general uptrend.
TON is currently trading at $1.8046, down by 0.86% so far today. It faces immediate resistance at a swing high of $1.98, in line with the psychological resistance level of $2. If it crosses this resistance, the next zone to watch would be between $2.0332 and $2.0822.
On the downside, TON finds immediate support in a horizontal zone ranging from $1.7686 to $1.8334, which also aligns with the Fib 0.236 level at $1.8084. This region could serve as a zone where TON may stabilize before its next price move.
Bitcoin BSC: Finding Real-World Utility in One of the Best Cryptos to Buy Now
Bitcoin BSC seeks to bring more than just hype to the crypto market. With features like staking rewards, low transaction fees, and quick transaction speeds, BTCBSC is focusing on long-term value.
Staking is a feature that lets token holders earn rewards, and it’s one of the core offerings of BTCBSC.
The token operates on the Binance Smart Chain (BSC) and has a reward distribution plan that spans 120 years, aligning with Bitcoin block confirmations.
With 69% of its total token supply of 21 million set aside for rewards, BTCBSC is attracting interest from investors.
Staking in BTCBSC is operational even before its official listing on the decentralized exchange PancakeSwap.
BTCBSC has outlined a four-stage roadmap focused on creating lasting value within the Binance Smart Chain ecosystem.
The presale phase, set for the third quarter of 2023, will offer 29% of the total token supply at $0.99. Funds from the presale will be used for the project’s development and marketing.
Following the presale, staking will be activated to encourage early participation.
The official token launch is planned for the fourth quarter of 2023 on a Binance Smart Chain Decentralized Exchange.
2% of the total token supply will be used to provide liquidity, ensuring the project’s decentralization and community ownership.
In the final stage, BTCBSC will focus on passive income opportunities. Starting in the fourth quarter of 2023, token holders can stake their tokens for daily payouts.
This stage is designed to provide stability and positive returns to network participants, strengthening its case as one of the best cryptos to buy now.
By offering a clear roadmap and features like staking, BTCBSC is carving out a niche for itself as a more practical and potentially reliable crypto option than other staking coins.
Visit Bitcoin BSC Now
RNDR Makes Strides: Retaking Resistance Levels and Eyeing a Potential Trend Reversal

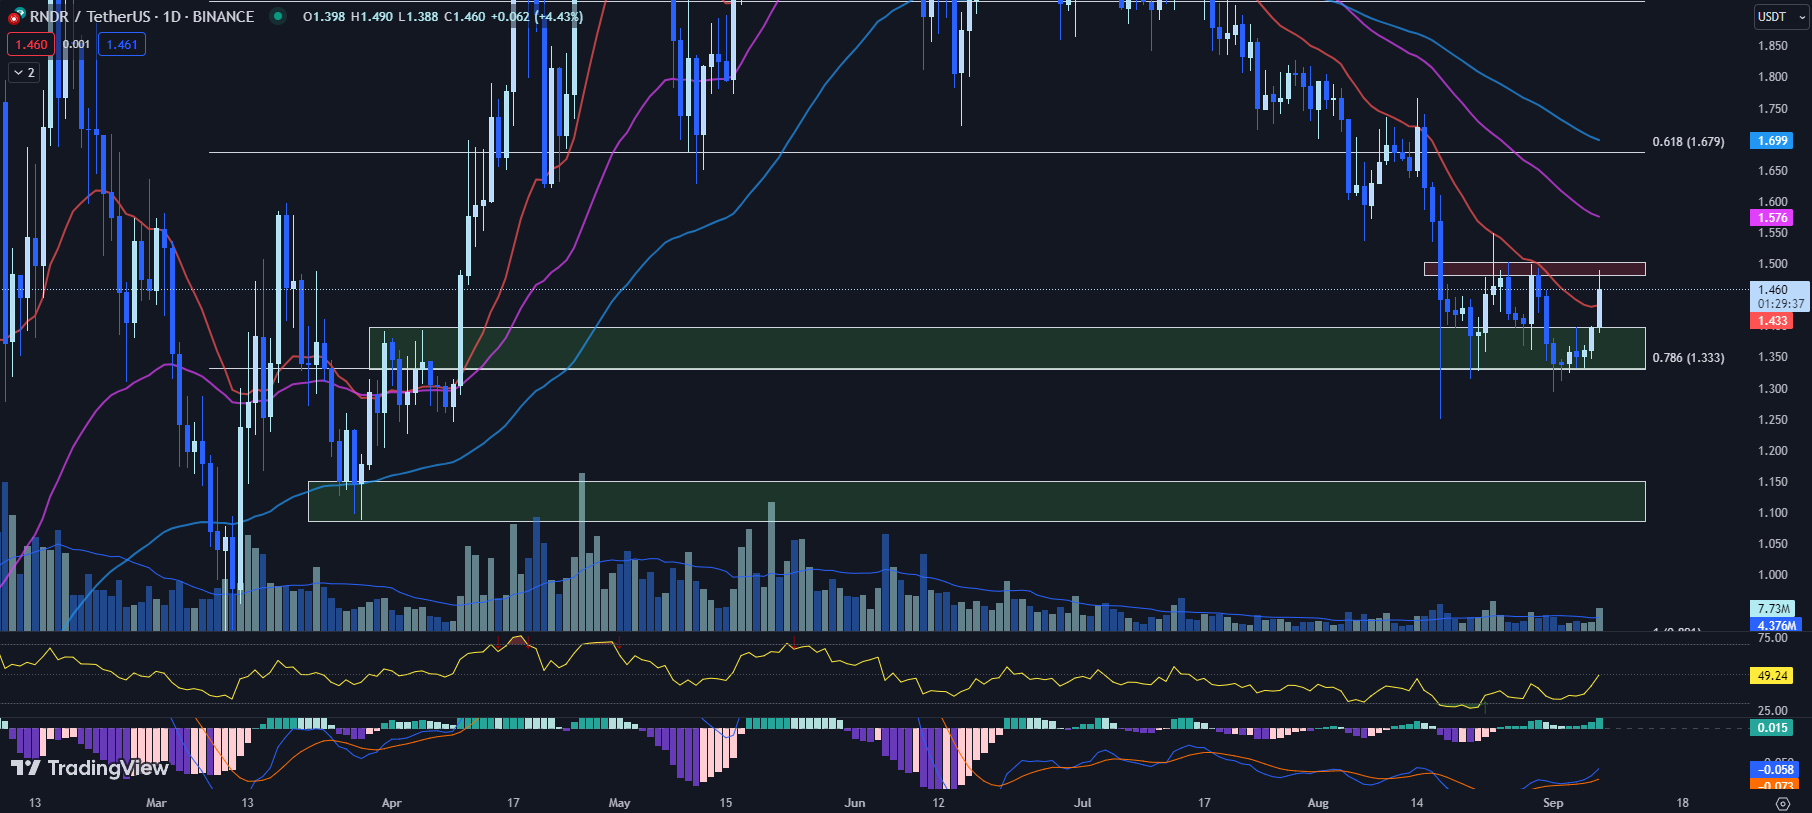
Render (RNDR) is showing some signs of potential change in its price action. After 53 days of struggling to move above its 20-day EMA, the cryptocurrency is currently trading above this level at a price of $1.460.
Should RNDR manage to close above the 20-day EMA of $1.433 in today’s trading session, this could suggest a possible trend reversal.
When it comes to technical indicators, the 50-day EMA stands at $1.576 and the 100-day EMA is at $1.699. These levels could serve as resistance if the price continues to move upward.
Meanwhile, RNDR’s RSI is currently at 49.24, up from yesterday’s 36.17. While the upward movement in RSI is generally seen as a positive sign, caution is advised. RNDR has not been able to move past the RSI level of 50 since July 13, so a rejection at this level is a possibility.
The MACD histogram has also seen a slight improvement, moving to 0.015 from yesterday’s 0.009. Additionally, both the market cap and 24-hour trading volume have increased; the market cap is now $544 million, up by 5.21%, and the 24-hour volume is $35.8 million, up by 166.56%.
In terms of resistance, RNDR is approaching a range of $1.482 to $1.503, which coincides with a psychological resistance level of $1.50. Breaking past this range could bring the next resistance into focus, which is the 50-day EMA of $1.576.
On the flip side, immediate support lies at the 20-day EMA of $1.433. Below that, there’s a horizontal support zone ranging from $1.331 to $1.399, aligned with the Fib 0.786 level of $1.333.
RNDR is at a critical juncture. Its performance in the immediate future will likely depend on whether it can hold above the 20-day EMA and break through the immediate resistance levels.
However, caution should be exercised, particularly considering the RSI and the historical difficulty RNDR has had in moving past certain technical levels.
Disclaimer: Crypto is a high-risk asset class. This article is provided for informational purposes and does not constitute investment advice. You could lose all of your capital.
Credit: Source link


