Price is increasing in Cardano market
ADA Price Analysis – August 13
Should the buyers gain enough momentum and the daily candle closes above $0.58 level, ADA/USD may increase to $0.62 and $0.69 levels. In case the sellers interrupt the buyers at $0.58 level, the bears’ pressure may likely decrease the price
ADA/USD Market
Key Levels:
Resistance levels: $0.58, $0.62, $0.69
Support levels: $0.54, $0.47, $0.41
ADA/USD Long-term Trend: Bullish
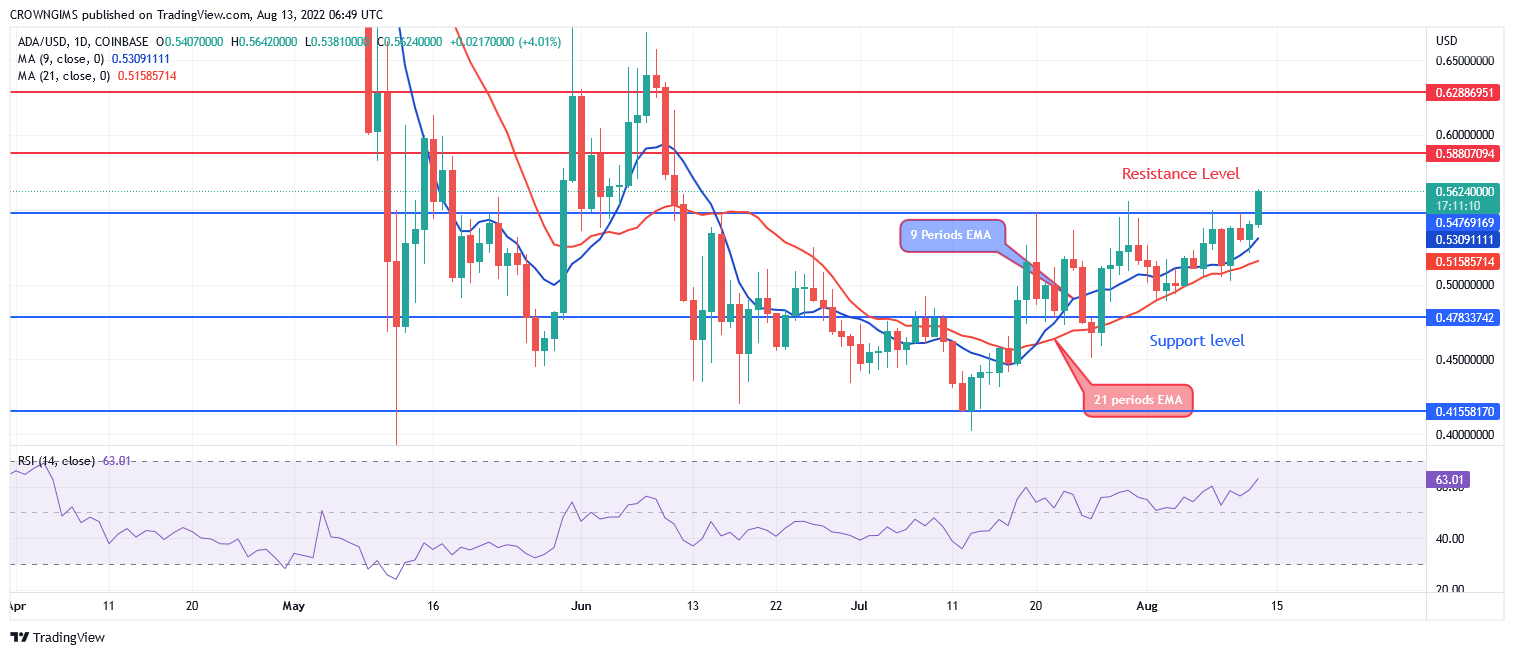
Cardano is bullish in the daily chart. Cardano was range-bound within the resistance level of $0.54 and $0.47 last week. ADAUSD is currently breaking out of the ranging movement that it was for two weeks. The bulls increase their momentum and push up the price at $0.54 resistance level. Today, the bulls are dominating the market and a daily bullish candle emerges. The price is heading towards $0.58 level.

The price has broken up the dynamic resistance level of 9 periods EMA and 21 periods EMA. Should the buyers gain enough momentum and the daily candle closes above $0.58 level, ADA/USD may increase to $0.62 and $0.69 levels. In case the sellers interrupt the buyers at $0.58 level, the bears’ pressure may likely decrease the price. However, the next support levels can be found at $0.54, $0.47, and $0.41 levels. The technical indicator RSI is at 63 levels with the signal line pointing upside which indicates a bullish signal.
ADA/USD Medium-term Trend: Bullish
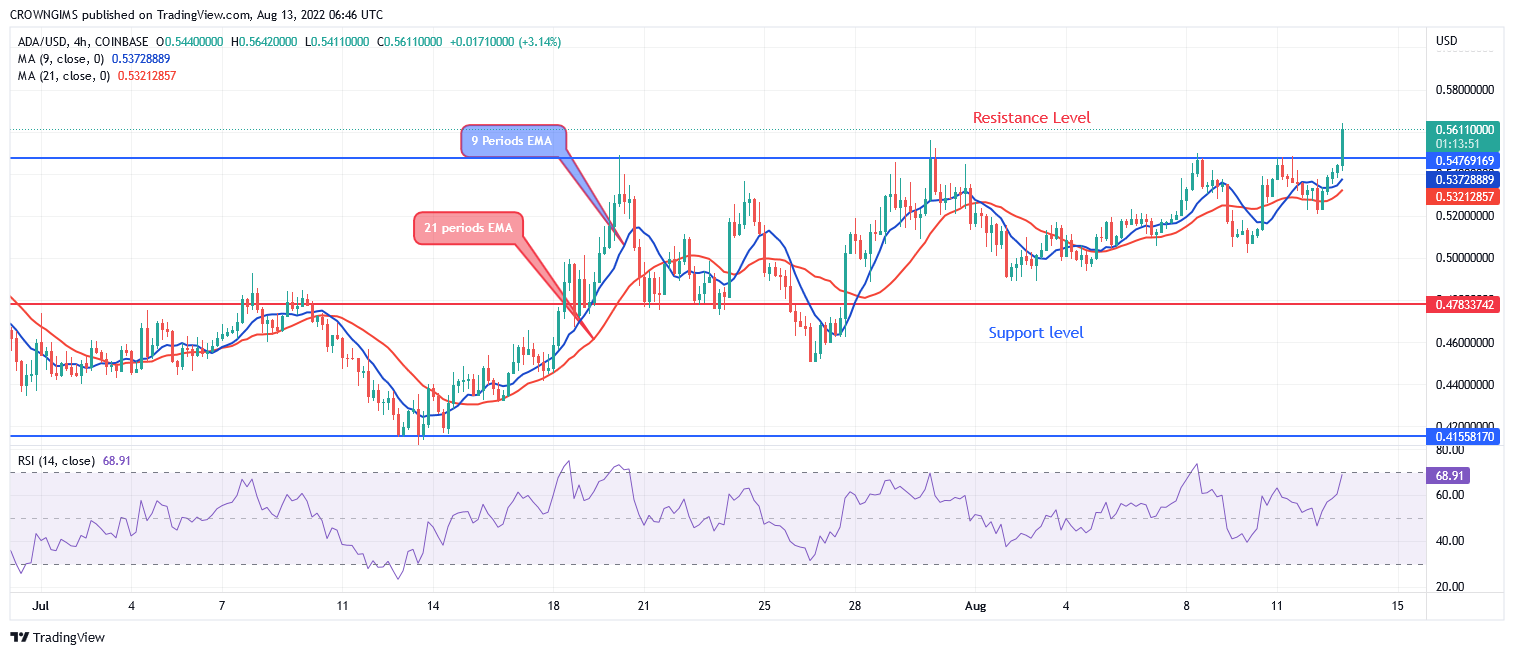
Cardano is bullish on a 4-hour chart. The crypto was range-bound within the resistance level at $0.54 and the support level at $0.47; this scenario commenced on July 27 when the coin tested the resistance level of $0.54 and the level hold the price. The bulls eventually break up the resistance level at $0.54 today and the price is increasing to the resistance level at $0.58 price level.

The 9 periods EMA has crossed the 21 periods EMA upside, the price has crossed the two EMAs and it is trading above the two EMAs. The relative strength index period 14 is pointing up at 69 levels to indicate buy signal.
Credit: Source link


