XRP Valuation Moves in Bearish Channels – November 29
It recorded that the Ripple XRP/USD market valuation moves in bearish channel lines as the crypto-economic price is trading around $1.00 as of writing. The market witnesses a percentage rate of about 1.34 positive to signify the possibility of getting upswings in the near time.
Valuation Moves in Bearish Channels: XRP Market
Key Levels:
Resistance levels: $1.10, $1.20, $1.30
Support levels: $0.90, $0.80, $0.70
XRP/USD – Daily Chart
The Ripple XRP/USD daily chart shows that the crypto coin valuation moves in bearish channel trend lines. The bearish channel trend lines drew to ascertain the correctional path that the market keeps. The 14-day SMA trend line has bent southward, closely touching the 50-day SMA trend line from the top. The Stochastic Oscillators are in the oversold region, attempting to indicate a move to the upside. It appears that long position takers may have to brace up for notable rebounding efforts that prices tend to be making around the current support level.
Could break down further at the $0.90 level pose a danger in the Ripple XRP/USD market as the crypto-economic valuation moves in bearish channels?
A break down at the $0.90 support level may not uphold on a long-term basis as the Ripple XRP/USD market valuation moves in bearish channels. At even a closer technical viewing point, the bearish trend connotes an ongoing price correction so that there can be a decent re-bounding motion for bulls to ride on.
On the southward movements of the technical analysis, the Ripple XRP/USD market bears should be very cautious of executing more shorting positions. The current trading situation requires traders willing to go shorting more to suspend their actions for a while. Even if a sudden price rejection eventually occurs in $1.00 and $1.10, traders will still have to be wary of launching sell orders.
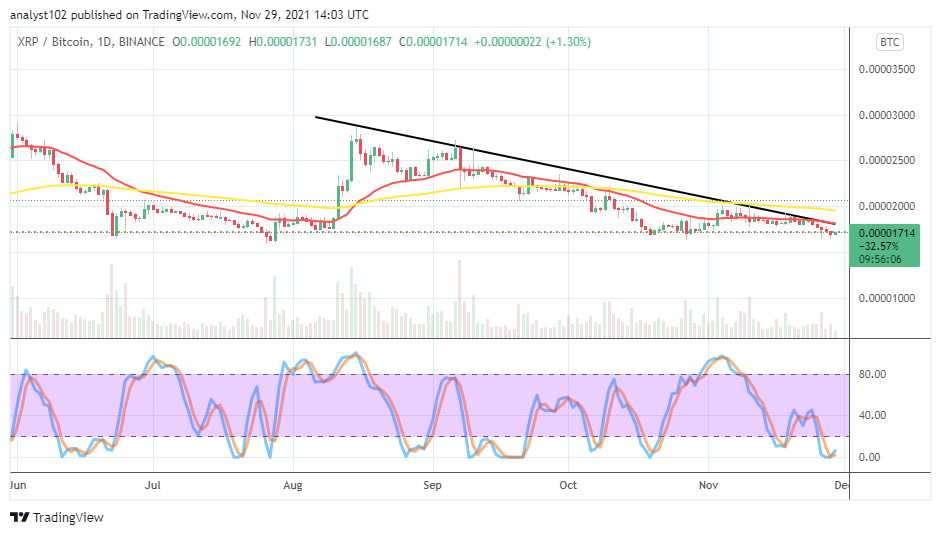
XRP/BTC Price Analysis
In comparison, the Ripple XRP market is, going under pressure as paired with Bitcoin. The cryptocurrency pair market valuation moves under the trend lines of the SMAs. The 50-day SMA indicator is above the 14-day SMA indicator. The Stochastic Oscillators are in the oversold region, with the lines closed at the range of zero, seemingly trying to point northbound within it. That suggests the possibility of getting to see the base crypto in the nearest time to push against the flagship counter crypto.
Looking to buy or trade Bitcoin (BTC) now? Invest at eToro!

68% of retail investor accounts lose money when trading CFDs with this provider.
Read more:
Credit: Source link


