Ethereum Price Prediction – November 18
The Ethereum price loses 5.39% at the time of writing as the price goes below the $4100 level to hit the next target support at $3800.
ETH/USD Market
Key Levels:
Resistance levels: $4800, $5000, $5200
Support levels: $3600, $3400, $3200
ETH/USD breaks below $4346 after an unsuccessful attempt to settle above $4400 handle during early Asian hours. At the time of writing, ETH/USD is changing hands at $4058, down 5.39% after touching the daily high of $4346. Looking at the daily chart, the 9-day moving average is about to cross below the 21-day moving average and once this is done; the second largest crypto may fall seriously.
Ethereum Price Prediction: Ethereum (ETH) May Struggle to Move Higher
According to the daily chart, a break above the resistance level of $4400 could most likely give the Ethereum price a boost towards the important resistance levels at $4800, $5000, and $5200. On the downside, the technical indicator Relative Strength Index (14) is currently having a bearish feel and it is likely to cross below 40-level to continue the downward movement.
However, if the coin stays below the moving averages, Ethereum could revisit $3800 support. More so, the market price may keep moving downward as long as the 9-day moving average crosses below the 21-day moving average. Meanwhile, the critical support levels to keep eye on are $3600, $3400, and $3200 which are towards the lower boundary of the channel.

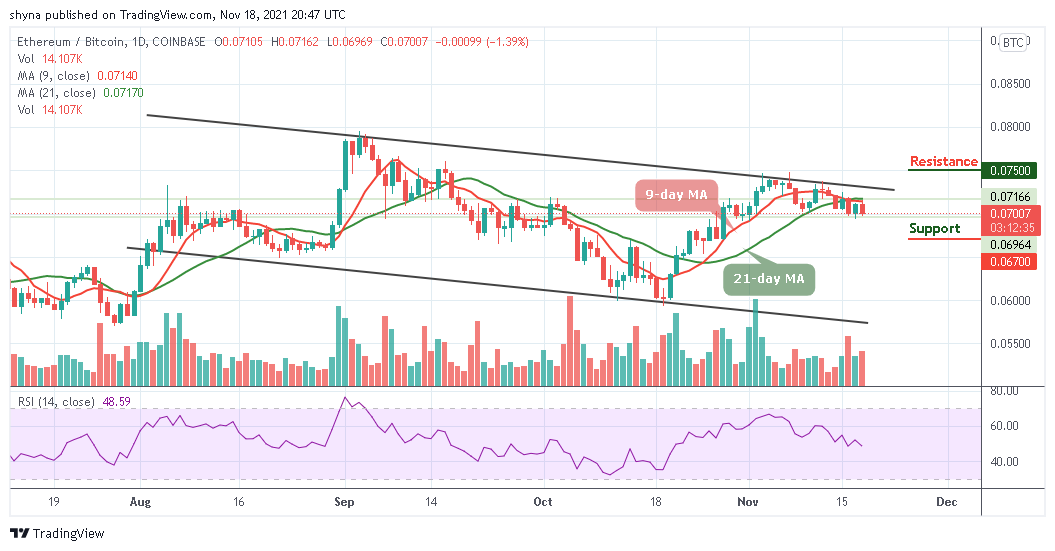
Against Bitcoin, we can see that Ethereum is clearly bearish. As the price falls, sellers are posing an additional threat into the market to reach the support level of 6800 SAT where the nearest target is located. However, an eventual break towards the lower boundary of the channel may cause Ethereum to collapse more.

Meanwhile, the continuation of the downtrend could hit the main support at 6700 SAT and below. Meanwhile, if a rebound plays out, a bullish trend may push the market above the upper boundary of the channel to reach the potential resistance of 7500 SAT and above. The technical indicator Relative Strength Index (14) confirms the bearish movement as the signal moves below 50-level, suggesting that more bearish movements may play out.
Looking to buy or trade Ethereum (ETH) now? Invest at eToro!
68% of retail investor accounts lose money when trading CFDs with this provider
Credit: Source link


