Join Our Telegram channel to stay up to date on breaking news coverage
Following the $93,000 break, the Bitcoin price prediction shows BTC dropping slightly after getting rejected at $93,161.
Bitcoin Prediction Statistics Data:
- Bitcoin price now – $88,893.51
- Bitcoin market cap – $1.77 trillion
- Bitcoin circulating supply – 19.78 million
- Bitcoin total supply – 19.78 million
- Bitcoin Coinmarketcap ranking – #1
Getting involved in crypto projects early is often recommended, as potential gains can be extraordinary over time. Take BTC as an example: its price has risen dramatically since it was first listed. Starting from an all-time low of just $0.04865 in July 2010, BTC has surged to an all-time high of $93,434.36, achieved only yesterday. This represents a staggering increase of over 183 million percent in 14 years – a figure that exemplifies the incredible growth potential seen in crypto when investing early. Even within the last 24 hours, BTC has demonstrated significant price movement, trading between $87,583.99 and $91,765.22, illustrating its value and volatility as it reaches new milestones.
BTC/USD Long-term Trend: Bullish (Daily Chart)
Key levels:
Resistance Levels: $98,000, $100,000, $102,000
Support Levels: $78,000, $76,000, $74,000
On the daily chart, BTC/USD recently faced resistance around the $90,000 level, a significant barrier it has tested multiple times without a clear breakout. This level remains a key resistance point, and the market shows signs of consolidating below it. The consolidation within this range suggests that BTC is currently at a decision point, where a breakout above this level could signal further bullish momentum. At the same time, a failure to hold support could lead to a retracement.
Bitcoin Price Prediction: Bitcoin Price May Consolidate Around $89k
The daily BTC/USD chart shows that Bitcoin is at a critical juncture, with major economic data poised to impact its price direction. Traders should keep an eye on key support and resistance levels, as well as market volume and momentum indicators, to gauge whether Bitcoin will continue consolidating or make a definitive move in the coming days.
Looking at potential price scenarios, a breakout above $90,000 on the daily chart could open the path to higher levels, with targets around the resistance levels of $98,000, $100,000, and $102,000. Conversely, if Bitcoin fails to break out and instead pulls back, support levels of $78,000, $76,000, and $74,000 are expected to offer a potential floor for price action. Meanwhile, the $70,000 level represents a worst-case support on the daily chart, though this is less likely under current market conditions.
BTC/USD Medium-term Trend: Bullish (4H Chart)
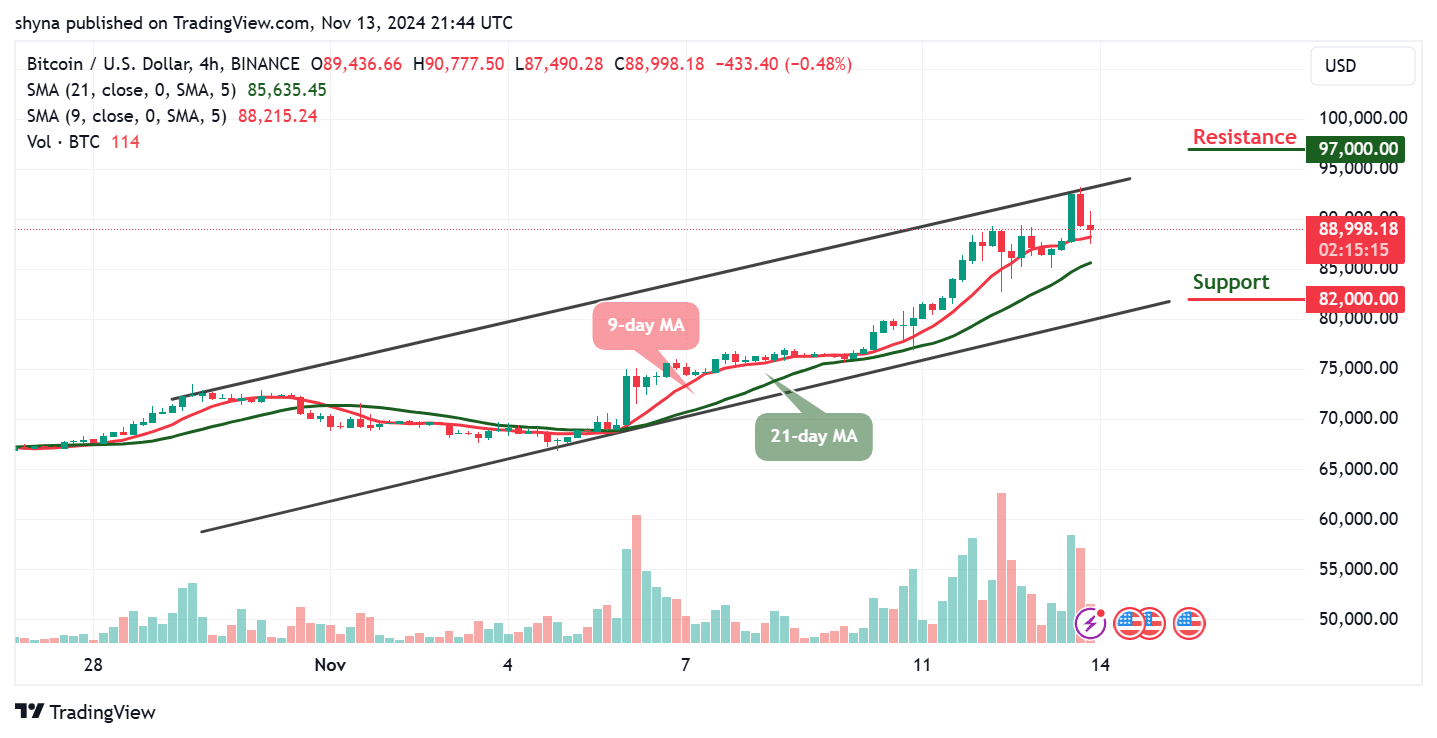
On the 4-hour chart, BTC/USD shows signs of consolidation around a key resistance level near $90,777, where recent price action has faced repeated rejections. This level has acted as a strong barrier, holding back any immediate bullish momentum. While the market appears to be forming a range in this zone, economic data such as the CPI and inflation rate announcements will likely drive the next decisive move.

However, if Bitcoin fails to hold above the current support levels on the 4-hour chart, a pullback to the $84,000 – $85,000 range could unfold. This would maintain a generally bullish outlook, although a deeper retracement to the support level of $82,000 and below could occur if the downside pressure intensifies. Meanwhile, the 4-hour chart indicates that open interest remains high, hinting at increased volatility ahead of upcoming economic data, which could locate the resistance level of $97,000 and above.
Nevertheless, @CrypNuevo shared with followers on X (formerly Twitter) their perspective on $BTC trading triggers. They explained that while it’s not necessarily a prediction, a price spike to the $95k-$96k range would signal a short opportunity, as a pullback could occur when expectations for $100k are high. Additionally, they would consider potential long positions based on BTC Dominance (BTC.D), evaluating whether to favor Bitcoin or altcoins.
Not necessarily what I think it’ll happen but just what would give me the most trade triggers.
A spike to $95ks-$96k from here is a short trigger for me because they’ll pullback when everyone expects $100k next.
And I’d look what to long based on BTC.D (BTC or alts?). pic.twitter.com/af4jyx7OSm
— CrypNuevo 🔨 (@CrypNuevo) November 14, 2024
Bitcoin Alternatives
Bitcoin (BTC) may remain in a consolidation or minor pullback phase until the impact of today’s economic data becomes clear, with traders preparing for potential volatility around key levels; a break above $90,000 could signal bullish momentum, while a drop to $81,000 might indicate further downside. Meanwhile, PEPE Unchained, a new meme coin alternative to Pepe the Frog, is set to list on a Tier 1 exchange in 28 days, building on the success of Pepe, which surged after listings on Coinbase and Robinhood. Strong market interest in PEPE Unchained is evident, with over $30 million raised in its presale and a growing social media presence, and its tokenomics feature a total supply of 8 billion tokens allocated for pre-sale, staking, marketing, and development.
PEPE UNCHAINED MEME COIN Listing on Tier 1 CEX in 28 DAYS!! Next 100X Crypto
The Pepe Unchained token is already raising over $30 million, the presale is gaining traction as traders prepare for what could be the next big movement in the meme coin market. For those looking to diversify and capitalize on the current wave of “extreme greed” in crypto, PEPE Unchained offers a promising investment entry point before the listing drives substantial interest and volume.
Visit Pepe Unchained
Related News
Most Searched Crypto Launch – Pepe Unchained
- Layer 2 Meme Coin Ecosystem
- Featured in Cointelegraph
- SolidProof & Coinsult Audited
- Staking Rewards – pepeunchained.com
- $10+ Million Raised at ICO – Ends Soon
Join Our Telegram channel to stay up to date on breaking news coverage
Credit: Source link


